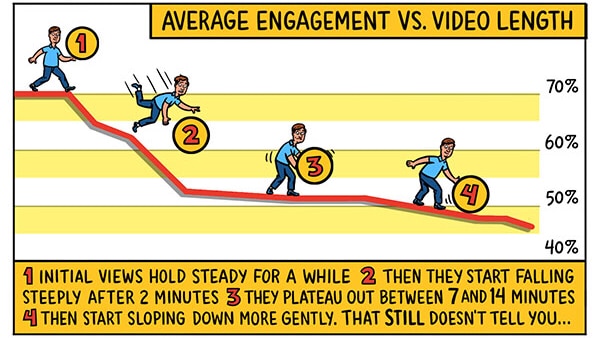
Infographics have long been a popular way to impart information. They’re usually made with vectorized graphics. At IdeaRocket, however, we’re big fans of the comic book form — nearly all of our staff and freelancers are current or past practitioners, and I think it’s fair to say that all of us are fans. So we thought… why not use the comic book form to impart information in a graphic way? What we came up with is what we might call a Toongraphic, the first example of which you can see below. This one is written by me and designed by our Associate Creative Director, Robert Kopecky.
When speaking with clients about video length, I’ve often referenced two studies that video host Wistia has posted, so that’s the material we referenced. We tried to add some value by interpreting the results: it’s not a matter of finding a theoretical “best length,” it’s a matter of balancing your needs with the observed tendencies of your audience.
Finally, if the graphic is valuable to you, please share! We’ve tried to make it easier by providing you with some embed code. Enjoy!
[embedit snippet=”infographic_colored”]