
Why do you make a business video? Yes, video is a rising medium. Yes, it engages customers and helps you convey a lot of information quickly. But the real reason you make a video is to help you reach a specific business goal. When you calculate ROI, you find out whether you succeeded or failed.
Actually, you don’t have to wait until after you’ve made the video to calculate your return on investment (ROI). Using an ROI calculator before you start a video project can help you decide if it’s worth making the initial investment.
In this post, we’ll take a look at common goals for different types of videos and how you can find or forecast your ROI for each one. Since ROI formulas can be complex, we’ll even give you a handy web-based ROI calculator to help you figure out your return on lead generation videos.
1. Identify your goal
Calculating video ROI can be tricky, but if we take it a step at a time you will master it in no time. The first step is knowing what your goal is. What do you want to accomplish with your video? How does it fit into your overall marketing strategy?
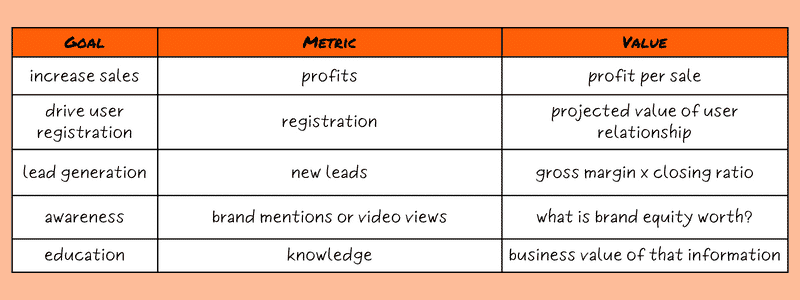
The five most common goals we encounter are:
- Increasing Sales (common in B2C commercials)
- Driving User Registration (for SaaS companies)
- Generating Leads (common in B2B explainers)
- Boosting Brand Awareness
- Education (common in healthcare or training videos)
Savvy marketers may notice that some of these goals feed into each other. Boosting brand awareness could help you increase sales. Educating customers could you drive user registration. It’s a good idea to define your objective as narrowly as possible for each video campaign.
Ask yourself: what is the proximate result that will show me this video has succeeded?

2. Match Metrics to Your Goals
Each of the goals listed is measured using a different metric or key performance indicator. Try to measure a goal using the wrong metric and you’re likely to be disappointed by the results.
If your goal is increasing sales your metric is likely to be number of sales or if you are selling different types of items, total profit.
If your goal is driving user registration, your metric is registrations,
and if your goal is lead generation, your metric is new leads, however they are qualified.
You’re almost certainly already tracking profits and registrations. Lead generation is easy to track too, but not automatic. Ideally, you’re using CRM software that monitors lead generation for you. If you don’t use a CRM, or the web-to-lead functionality isn’t available, you can use a website or conversion pixel to understand how video views translate into new leads.
Things get even more tricky when we get to the last two goals on our list.
If your goal is awareness, your metric might be brand mentions or video view count.
Surveying potential customers is probably the most accurate solution, but it can be expensive and relies on people choosing to answer a survey. Instead, you can:
- monitor searches of your brand name in Google Analytics and on social media
- set up a Google Alert to watch for mentions of your brand online
- monitor video views and watch-through on your site or social media accounts.
If your goal is educating potential customers, your metric is knowledge, which is hard to measure. You can add a quiz at the end of your video. Even a simple survey that asks users to rate the helpfulness of this video can be useful. You can also pay attention to the kinds of questions customers usually ask. Has your video cut down on queries around this topic?
3. Assign a Dollar Value to the Metric
What do you gain when your video succeeds? Try to value that gain in dollars.
For sales, your dollar value is the additional profit from each sale. Remember to use your gross margin, not your operating margin. Why? Because your cost for creating a video is fixed. Each additional sale brings you the gross margin in additional profit, not the operating margin.
If your goal is user sign-ups, you can use the average lifetime value of a user relationship as your dollar value.
For lead generation, multiply your gross margin by your closing ratio – that is the dollar value of each lead.
Putting a dollar value to awareness is difficult, but a good exercise. What is brand equity worth to you – or issue awareness, if the goal is political?
As for education, you need to calculate the business value of the knowledge you’re spreading. Not so long ago we made a job safety video for a major oil company. They told us that knowledge retention in their safety courses was as low as 10%, and they hoped that our dynamic, entertaining approach would increase that retention. If we help prevent even one major injury at an oil site, those videos would easily justify their cost.
4. Compare Performance
A/B testing is the gold standard for evaluating video performance. To do it successfully, you need to be able to deliver two different experiences to two sets of randomly assigned users. You might A/B test a video-first experience against a text-based one, or compare two video ads against each other.
Because A/B testing takes time and resources, it’s not always possible. Maybe your audience is small or you don’t want to dilute the impact of your video by only using it with half your audience.
When that is the case, you can compare two time periods instead. Choose a time before your video was launch and compare your metrics from that time with the time after the video launched. Make sure the timeframe you choose is long enough to offer a clear picture.
Also, make allowances for seasonal variations or other factors. For instance, if you’ve introduced a new website along with your video, both should share credit (or blame) for the results.
5. Calculate ROI for Your Video
The steps for calculating ROI look complicated, but they’re actually pretty straightforward. Before we break them down, a note on terminology. We use the word unit as short-hand for the smallest element of the metric you’re trying to measure. So your units could be users, dollars, leads, brand mentions, or informed users.
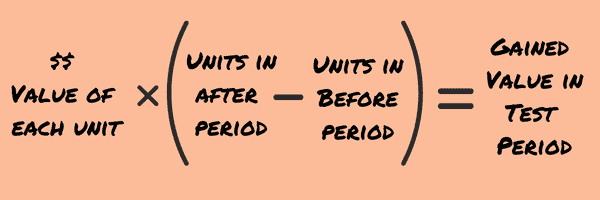
Step One: Find the value gained during the test period
You do this by subtracting your before metrics from your after metrics. So if you started with 25 users and ended up with 100, you’d subtract 25 from 100 to get 75 new users.
Then you multiply the dollar value of each unit by the number of new units. This shows the value you gained during the test period.
Step Two: pro-rate this value
You may have run a 1-month test, but you want to know how much the video will increase net profit over the course of a year. To find the total gained value, divide the amortization period by the length of the test period and multiply by the gained value you found above.

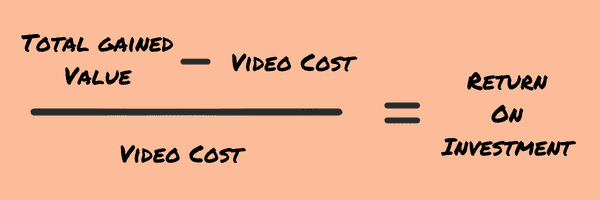
Step three: calculate your return
Finally, you calculate how these returns compare to your initial video investment. Do this by subtracting the video cost from the total gained value and dividing by the video cost.
Skip to the calculator to give it a try!
A Sample ROI Calculation
Let’s take a hypothetical business – a consultancy of some sort. Last year they received 1,000 leads, and closed 50, which means their closing ratio was 5%. They had 50 contracts, with an average value of $20,000, so their total revenue was $1,000,000. Their gross margin was 40%, and they made a video for $20,000.
What is the unit we are measuring?
A lead.
What is the dollar value of each unit?
40% Gross Margin x $20,000 average contract value x a closing ratio of 5% = $400
Let’s say they tested their new video for three months, year-over-year. In the ‘before’ period they received 250 leads. In the ‘after’ period they received 300 leads. So the Gained Value During Test Period was 50 leads multiplied by $400, or $20,000.
They expect their video will work for one year, so the Total Gained Value will be $80,000.
Finally, we subtract the video cost from the total returns and get $60,000. We divide that by the video’s cost of $20,000 to get 300% ROI – pretty good returns!
Is hoping for a 20% improvement in performance realistic? Your mileage may vary, but in our experience, yes. We’ve seen video boost conversions by as much as 63.9% for one cloud data services company.
Calculator for Lead Generation Videos
Since lead generation is probably the most common objective we encounter, we’ve created a calculator that does the math for you. We don’t collect data from these fields, so feel free to play around with different scenarios in privacy.
Directions: Establish two comparable periods over which to measure your results (before and after you introduce your video.) These periods should be long enough to provide good sample data, but not so long as to delay the receipt of the information beyond when it is useful. If your business has seasonality, consider using the same period from a past year.
For help figuring out what to enter in each field, check the input definitions below.
Input Definitions
Line 1: Gross profit margin is the percentage of your total revenues that is profit after your cost of goods sold (COGS) is deducted but before fixed expenses (overhead) are subtracted.
Line 2: Average Sale/Contract This is the average revenue from each of your sales or contracts. If you get a lot of repeat customers or recurring revenue, you might consider using average customer lifetime value for this field.
Line 3: Closing Rate – the percentage of your leads that become customers.
Line 4: Previous Number of Monthly Visitors – the number of monthly visitors that reached the page where your video will live, in the ‘before’ period.
Line 5: Subsequent Number of Monthly Visitors: This is the number of monthly visitors that reach the page where your video will live, in the ‘after’ period. This number should be greater than line 4 only if you anticipate that social media or email distribution of the video might drive new visitors to your site. Any increase in visitors will be attributed to the video.
Line 6: Previous Conversion Rate – the percentage of visitors to your page (line 4) that became leads in the ‘before’ period.
Line 7: Subsequent Conversion Rate – the percentage of visitors to your page that become leads, in the ‘after’ period.
Line 8: Amortization Period – the number of months over which the tool will calculate your returns. Enter a number that represents the likely life of the video. (we recommend 24 months)
Line 9. Cost of Video – how much you spent, or anticipate spending, on a video.
Output Definitions
Line 10. Additional gross revenue – This is the amount of additional sales that your video has created, or is likely to create. If you would like to make a spreadsheet to recreate this calculator and perhaps add additional inputs, here is how we make the calculation: =((5*7*3*2)-(4*6*3*2))*8
Line 11: Video ROI – the Return on Investment your video has yielded, or is likely to yield. Any amount greater than 0% is a positive return!
If this calculator has made you more confident about your chances of achieving positive ROI with an animated video, don’t hesitate to reach out to us. IdeaRocket creates videos in 2d animation, 3d animation, whiteboard and live action, as well as combinations of these techniques (mixed media.)